
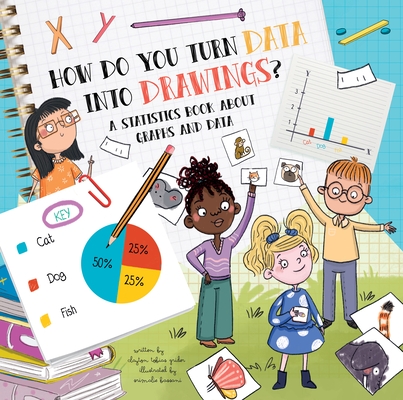
Have you ever wondered how to turn data into graphs and charts? A basic explanation of statistics concepts including descriptive and inferential statistics, collecting and recording data, how to make various graphs, and more is explored through charts, illustrations, and informative text in this new addition to the How Do series. Includes activities in the back of the book.
About the How Do series: These fully-illustrated nonfiction picture books are a great introduction to various STEM topics. Each title includes facts and figures, simple diagrams and hilarious illustrations and is written in a question-and-answer format to encourage readers to ask questions and guess the answers before exploring the science behind the correct answers.Author: Clayton Grider
Binding Type: Hardcover
Publisher: Flowerpot Press
Published: 03/12/2024
Series: How Do?
Pages: 36
Weight: 0.74lbs
Size: 9.21h x 9.19w x 0.39d
ISBN: 9781486729708
Language: English

Reviews
There are no reviews yet.